MIPAL
The brief
Mipal set out to make enterprise analytics accessible to anyone who works with data — not just the engineers and analysts who can write SQL. The pain was familiar inside large consulting and infrastructure firms: a partner asks a project lead for a chart, the project lead pings the data team, and a two-line question becomes a two-week ticket. By the time the answer comes back, the meeting is over and the decision has already been made on instinct.
Our remit was to compress that loop to seconds. A working professional should be able to drop a file (or point at a database), describe what they want, and have a clean, defensible chart ready for the next stand-up — without ever opening a query editor.
An AI analyst, not a BI dashboard
Most BI tools hand the user an empty canvas and assume they know what chart they want. Mipal flips that: the platform reads the data first, figures out what's interesting, and proposes the analysis. A coordinated set of specialized agents handles each step, with a deterministic evaluation gate between them.
- Data-Profiler agent — scans the incoming dataset, infers types, finds primary keys and join candidates, and flags quality issues (nulls, outliers, encoding drift) before any chart is rendered.
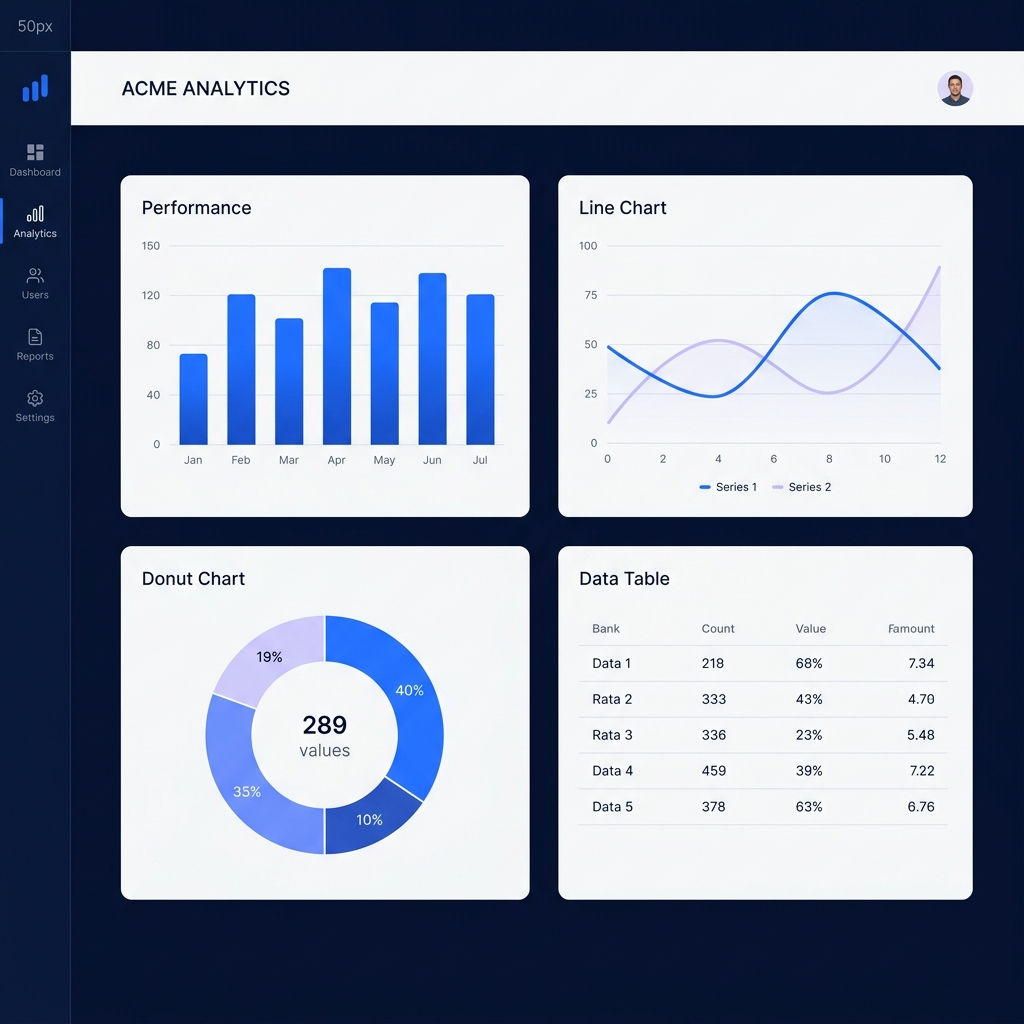
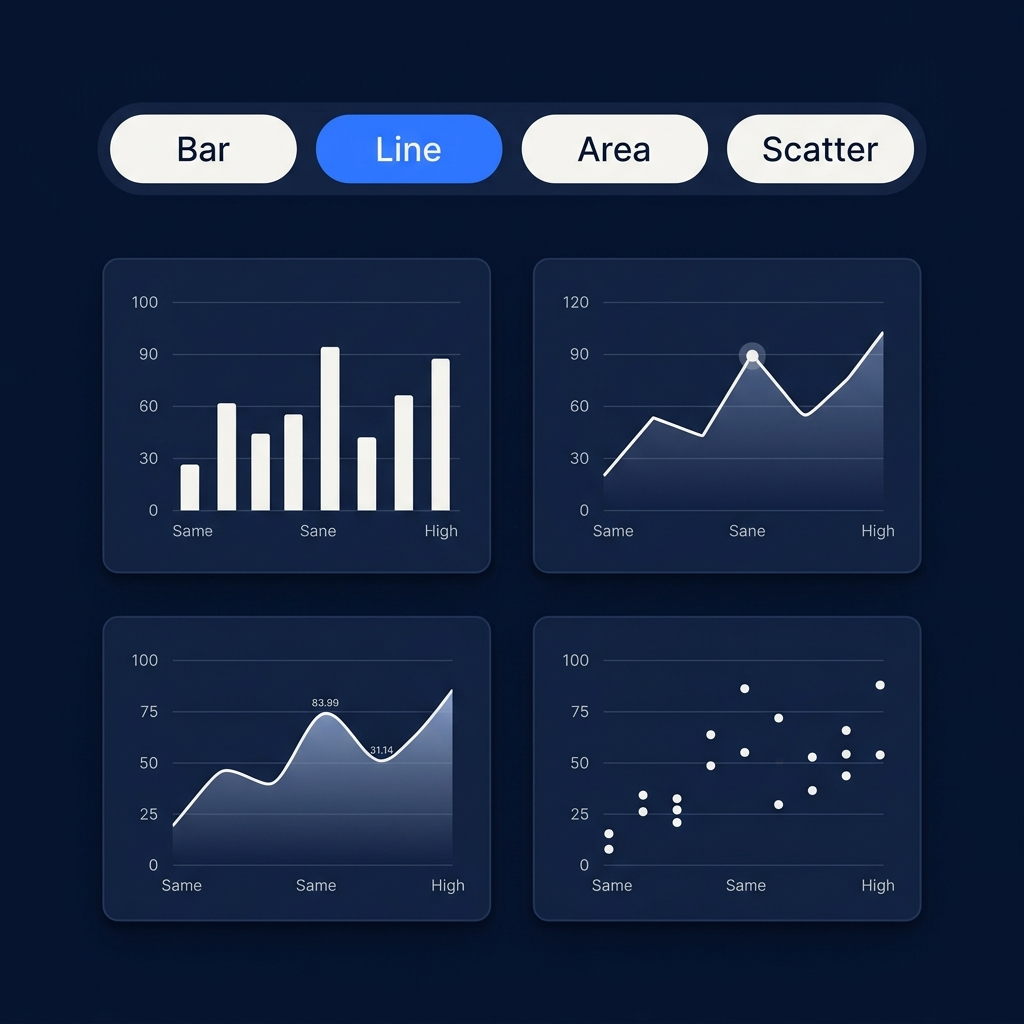
- Chart-Selector agent — maps the profile to a ranked list of chart types: distributions get histograms, time series get line and area, categorical comparisons get bars, and proportions get donuts. The user can switch chart type on any tile and the underlying mapping is preserved.
- Insight-Writer agent — produces short, plain-English commentary on each chart: "Q3 revenue grew 18% over Q2, driven entirely by the EMEA segment." Always cited back to the rows that generated the claim.
- Query-Interpreter agent — translates natural-language questions ("show me churn by region last quarter") into typed analytical operations, runs them against the connected dataset, and renders the result inline.
- Dashboard-Composer agent — assembles the most useful charts into a starter dashboard that the user can then refine with drag-and-drop, so the first version of the dashboard ships in under a minute.
Every agent emits structured artifacts — schemas, queries, chart specs — so the platform always knows how each visual was produced and can re-run, share, or audit it later.
Connectors that meet teams where their data lives
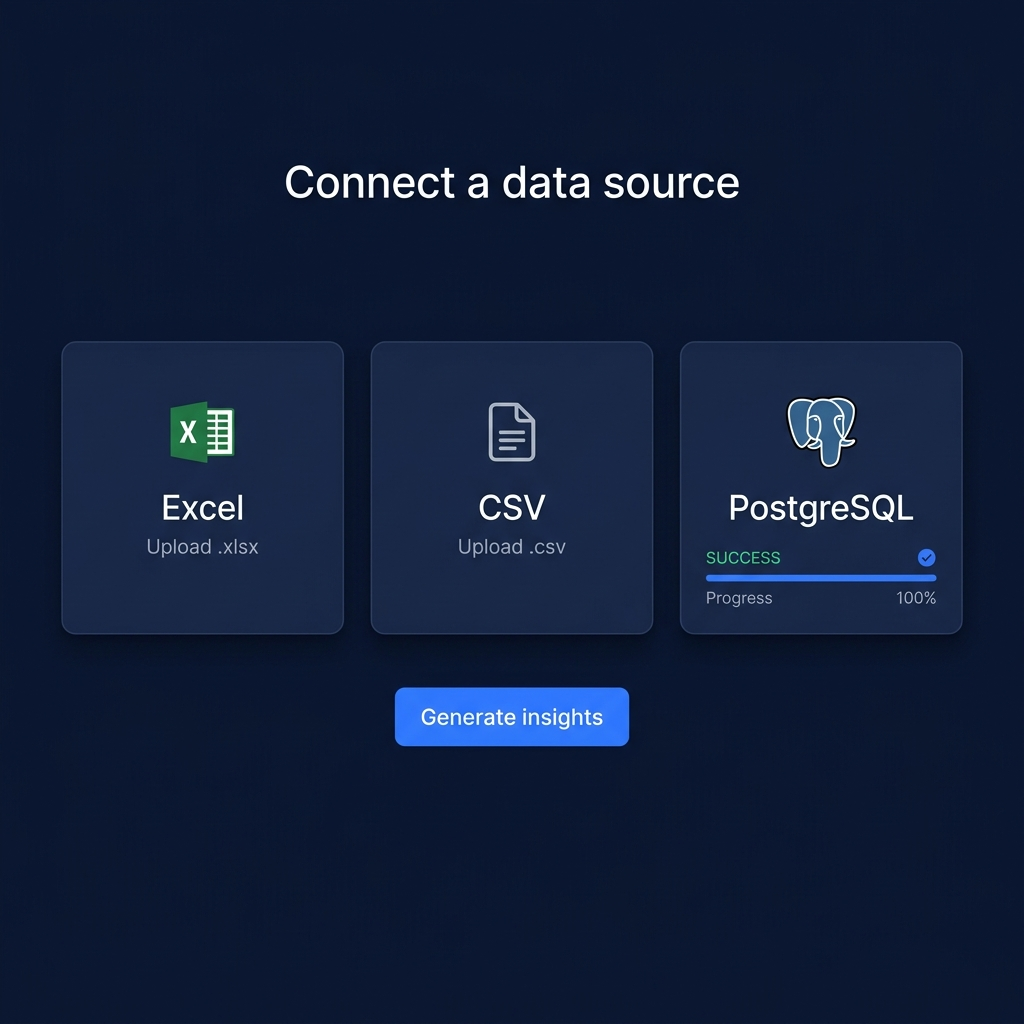
Enterprise data is messy and lives in a dozen places. Mipal supports the three sources that cover the vast majority of real-world analyst workflows:
- Excel (.xlsx) — multi-sheet workbooks with merged cells, named ranges, and pivot tables are parsed into a tidy relational structure automatically.
- CSV — large flat files are streamed in chunks; encoding, delimiter, and header rows are detected on upload with a one-click override.
- PostgreSQL — read-only connection strings provision a sandboxed warehouse view; Mipal never writes back, and every query is logged for the customer's own audit trail.
All ingestion runs inside a per-tenant sandbox with row-level isolation. Sensitive datasets never leave the customer's compliance perimeter, and uploaded files can be configured to auto-purge on a schedule.
What we shipped
We delivered the end-to-end product across a 16-week engagement:
- The ingestion pipeline — connectors, streaming parser, schema inference, and per-tenant data isolation.
- The agentic chart and insight engine — profiler, chart selector, insight writer, query interpreter, and dashboard composer running as a typed workflow with full audit logs.
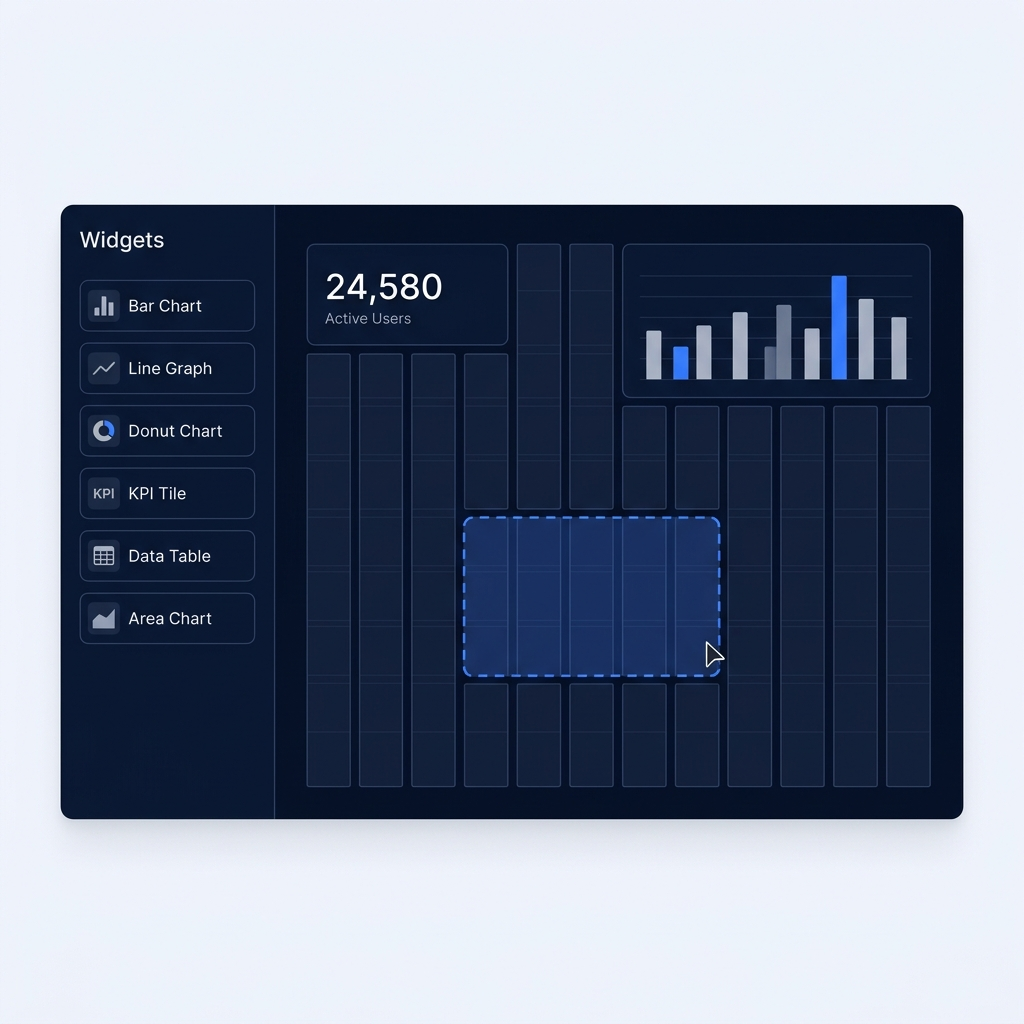
- A no-code drag-and-drop dashboard builder where users arrange charts on a snap-to-grid canvas, resize widgets, and re-bind data sources without writing a line of code.
- Sharing, permissions, and read-only public links so a finished dashboard can be sent to a stakeholder or embedded in an internal report.
- A self-serve onboarding flow — sign up, connect a source, and have a working dashboard inside the first session.
The result
Mipal is now used by enterprise teams at Deloitte, Mott MacDonald, and EGIS to turn raw data into live dashboards in under a minute — without SQL, configuration, or a dedicated analyst in the loop. The product replaces the slow back-and-forth between business and data teams with an interface anyone in the firm can drive.